Get 69% Off on Cloud Hosting : Claim Your Offer Now!


- Products
- Solutions
-
Solutions
-
 Cloud
Hosting
-
VPS
Hosting
-
 GPU
Cloud
-
 Dedicated
Server
-
 Server
Colocation
-
 Backup as a Service
-
 CDN
Network
-
 Window
Cloud Hosting
-
 Linux
Cloud Hosting
-
Managed
Cloud Service
-
 Storage
as a Service
-
VMware
Public Cloud
-
Multi-Cloud
Hosting
-
Cloud
Server Hosting
-
Bare
Metal Server
-
Virtual
Machine
-
 Magento
Hosting
-
 Remote
Backup
-
 DevOps
-
 Kubernetes
-
 Cloud
Storage
-
 NVMe
Hosting
-
 DR
as s Service
-
-
Solutions
- Marketplace
- Pricing
- Resources
- Company
 Remote
Backup
 NVMe
Hosting
 Pricing
Calculator
 Unlock Cost
Optimization
 Overview
 Documentation
 Price
Calculator
 Tools
 FAQs
 Terms
of Service
 Privacy
Policy

 Migration
 Container
 Power
 Utilities
 VMware
Private Cloud
 VMware
on AWS
 VMware
on Azure
 Certifications
 Partners
 Careers
 Support
 Service
Level Agreement
 Contact
Table of Contents
- What Is AIOps?
- The AIOps workflow
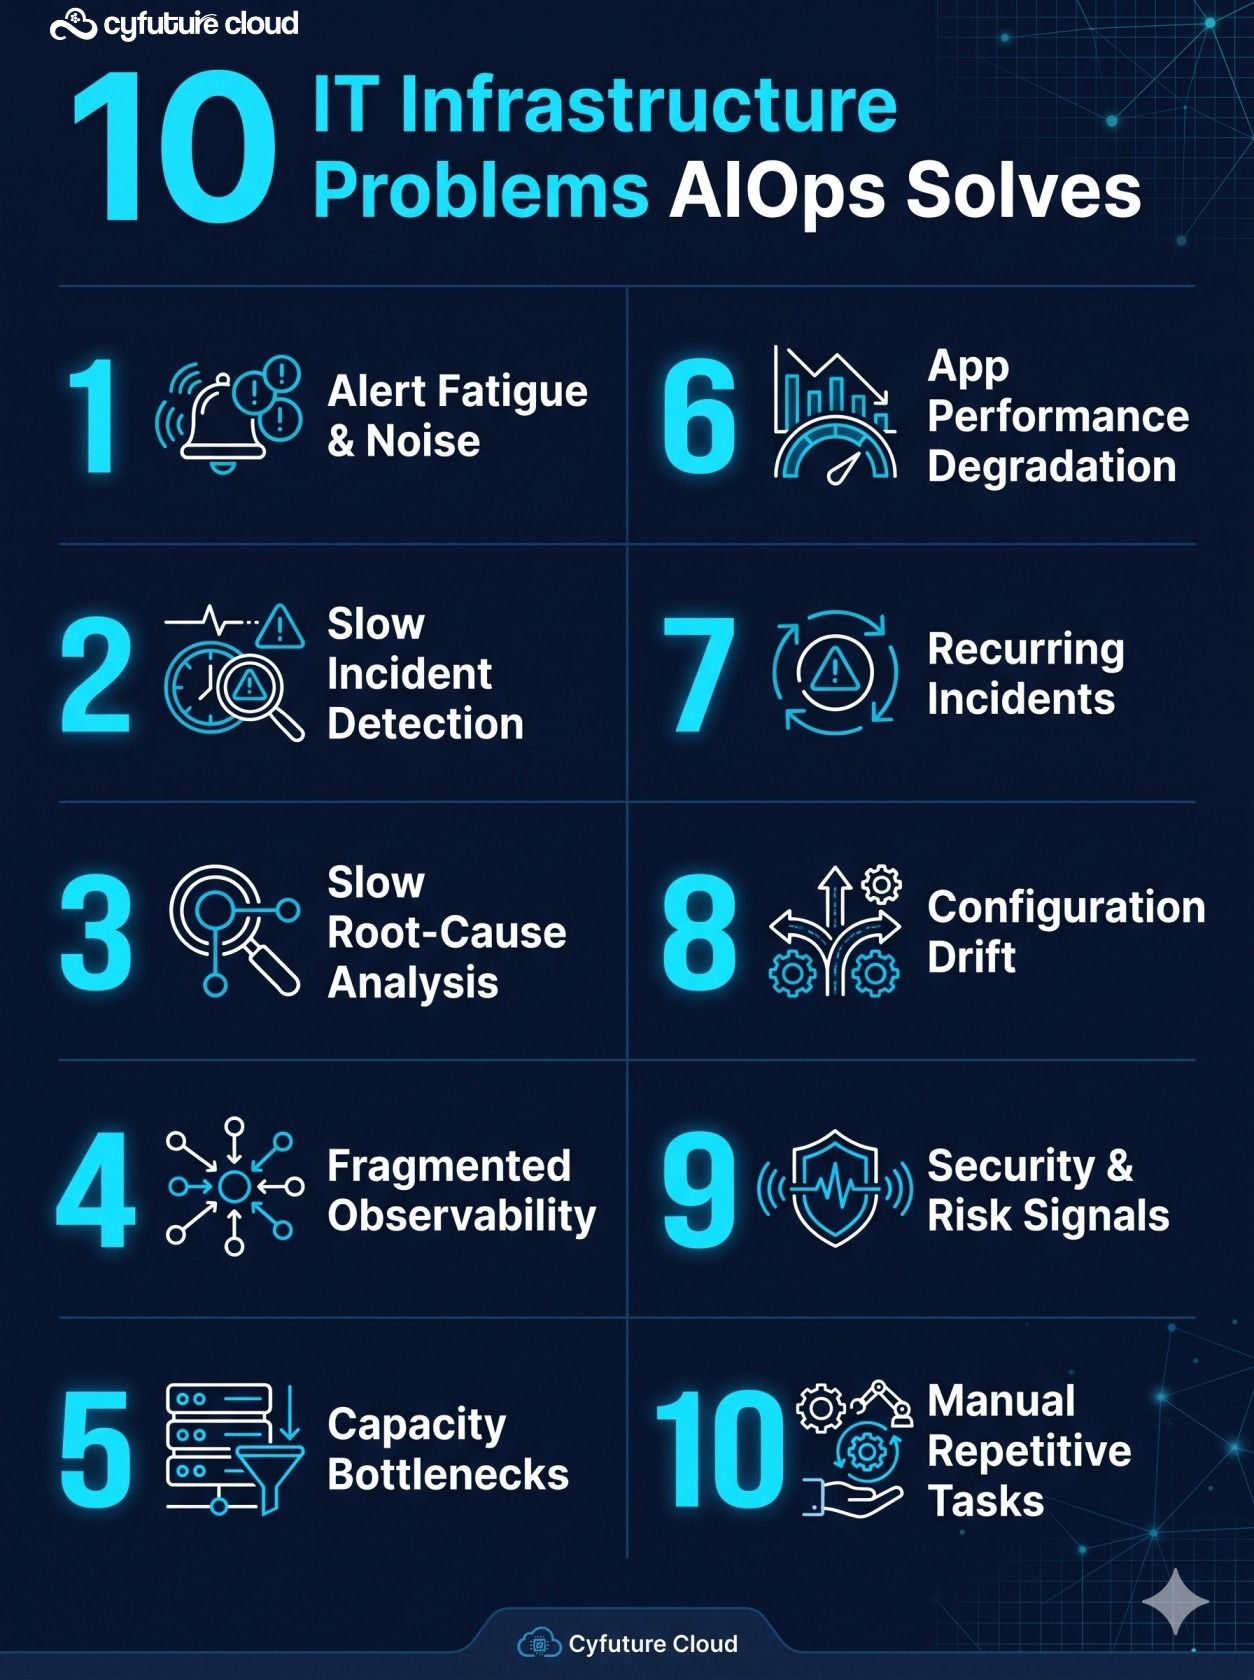
- 1. Alert fatigue and excessive noise
- 2. Slow incident detection
- 3. Slow root-cause analysis
- 4. Fragmented observability across hybrid environments
- 5. Capacity planning and resource bottlenecks
- 6. Performance degradation in applications
- 7. Recurring incidents and unknown failure patterns
- 8. Configuration drift and change-related failures
- 9. Security and operational risk signals
- 10. Manual, repetitive operational tasks
- AIOps benefits across the incident lifecycle
- What AIOps cannot solve alone
- How Cyfuture Cloud supports AIOps-ready infrastructure
- AIOps adoption roadmap
- Metrics to track
- FAQs
- Conclusion
Modern IT environments generate enormous volumes of logs, metrics, traces, alerts, and events across applications, servers, networks, databases, containers, and cloud services. The problem is often not a lack of data. It is too much fragmented data, too many alerts, and too little time to distinguish a meaningful signal from routine operational noise.
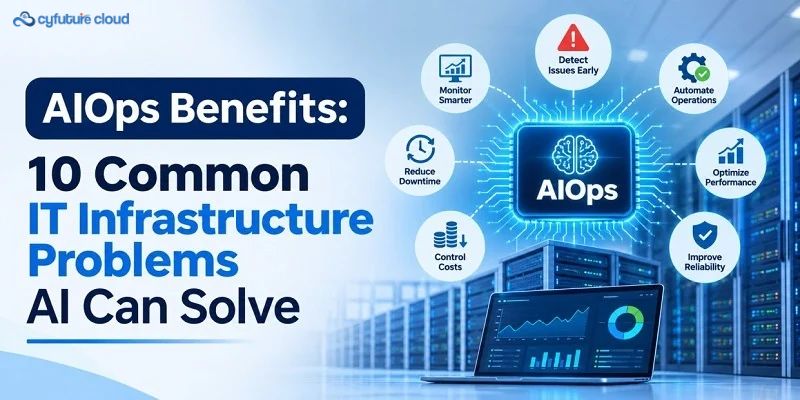
AIOps—Artificial Intelligence for IT Operations—helps operations teams convert that noise into useful signals. By applying machine learning, analytics, and automation to operational data, AIOps can help teams detect issues earlier, correlate related events, narrow down likely causes, and respond with greater consistency.
The practical AIOps benefits are not about replacing engineers. They are about giving IT, cloud, DevOps, and site reliability engineering (SRE) teams better context so they can reduce downtime, improve incident response, and operate complex infrastructure more efficiently.
What Is AIOps?
AIOps, or Artificial Intelligence for IT Operations, applies machine learning, analytics, and automation to IT operations data to improve the detection, diagnosis, and remediation of issues.
AIOps platforms typically consume several types of operational data:
- Metrics: Numerical measurements such as CPU usage, memory consumption, request latency, error rate, disk I/O, and network throughput.
- Logs: Time-stamped records generated by applications, operating systems, databases, and infrastructure components.
- Traces: Records showing how a request travels across services, which is useful for understanding distributed systems.
- Events: Discrete occurrences such as a deployment, restart, configuration change, or threshold breach.
- Alerts: Notifications generated when a monitored condition crosses a defined threshold or rule.
- Configuration data: Information about infrastructure, application settings, network policies, and resource allocation.
- Dependency maps: Relationships between services, applications, databases, networks, and infrastructure components.
- Change records: Deployment, patching, configuration, and release information.
- Incident tickets: Historical incident data, resolutions, and post-incident findings.
- User-experience data: Measurements such as page-load time, transaction success rate, and application responsiveness.
Core AIOps capabilities include data ingestion and normalisation, anomaly detection, event correlation, alert noise reduction, root-cause analysis, change-impact analysis, predictive analytics, automated remediation, capacity forecasting, and service-health scoring.
Observability is the ability to understand the internal state of a complex system from its external outputs—primarily telemetry. AIOps observability adds AI and machine learning to that telemetry to automate parts of collection, analysis, and operational workflows.
AIOps works best when it has high-quality telemetry, clear service dependencies, well-defined workflows, and human oversight. It is an operational capability, not a substitute for operational discipline.
The AIOps workflow
|
Stage |
What happens |
Example |
|
Data collection |
Collect metrics, logs, traces, and events |
CPU usage, error rate, latency, logs, alerts |
|
Normalisation |
Convert data into a consistent format |
Standardise timestamps, labels, and event fields |
|
Detection |
Identify unusual behaviour |
Detect abnormal latency or error rates |
|
Correlation |
Connect related signals |
Link a database slowdown to application errors |
|
Diagnosis |
Identify likely root cause |
Find a memory leak, bad deployment, or network issue |
|
Action |
Trigger response |
Create a ticket, notify on-call engineer, or run a remediation workflow |
|
Learning |
Improve future decisions |
Update models and workflows using incident outcomes |
Automation should be introduced progressively. Start with low-risk actions such as enrichment, alert routing, and runbook recommendations before allowing automated changes to production systems.
1. Alert fatigue and excessive noise
Problem: Operations teams often receive thousands of alerts from monitoring tools. Many are duplicate, low priority, or symptoms of the same underlying issue.
Why it is difficult: Traditional monitoring tools usually evaluate individual thresholds. They do not automatically understand that a database failure, API latency increase, Kubernetes pod restart, network timeout, and storage I/O alert may all belong to one incident.
How AIOps helps: AIOps uses event deduplication, similarity detection, correlation, alert clustering, dynamic thresholds, severity scoring, suppression rules, and context enrichment to reduce noise.
Technical example: A database failure may generate separate alerts for application errors, API latency, Kubernetes pod restarts, network timeouts, and storage I/O. AIOps can group these into one incident with a probable root cause, rather than sending five unrelated notifications.
Operational benefit: On-call engineers receive fewer, more meaningful incidents. This reduces alert fatigue and helps teams focus on issues that require action.
Implementation caution: Suppression rules must be reviewed regularly. Poorly designed rules can hide genuine problems.
2. Slow incident detection
Problem: Delayed detection increases business impact. A service may degrade for several minutes—or longer—before anyone notices.
Why it is difficult: Static thresholds often fail to distinguish between normal variation and an emerging problem. A CPU spike at 3 a.m. may be normal; the same spike during a business-critical period may not be.
How AIOps helps: AIOps continuously analyses real-time telemetry and identifies anomalies before a service-level breach occurs. Common approaches include statistical baselines, seasonal patterns, time-series forecasting, unsupervised learning, correlation-based detection, and change-aware detection.
Mean time to detect (MTTD) measures how quickly an issue is identified:
MTTD=Total time to detect incidents/Number of incidents
Technical example: A payment service normally handles a predictable traffic pattern. AIOps detects an unusual rise in p95 latency and error rate before the service breaches its service-level objective (SLO).
Operational benefit: Earlier detection gives teams more time to mitigate impact before customers are broadly affected.
Implementation caution: AIOps should not blindly flag every deviation. It must account for planned changes, seasonal traffic, deployment activity, and business cycles.
3. Slow root-cause analysis
Problem: Identifying the cause of an outage is often harder than detecting the symptom. Engineers may spend hours searching logs, checking dashboards, and questioning other teams.
Why it is difficult: Modern systems are distributed. A user-visible failure may originate in an application, database, network, container platform, configuration change, or third-party dependency.
How AIOps helps: AIOps can correlate logs, metrics, traces, topology, deployment history, and configuration changes to narrow down likely causes. This is known as AIOps root-cause analysis.
Mean time to restore (MTTR) measures how quickly service is restored:
MTTR=Total time to restore service/Number of incidents
Technical example: A checkout service becomes slow. AIOps correlates increased API latency, database connection errors, a recent deployment, and a spike in downstream service errors. It identifies the new deployment as the most likely cause and provides the on-call engineer with relevant evidence.
Operational benefit: Engineers spend less time searching and more time mitigating. This can reduce MTTR, although the improvement depends on telemetry quality and workflow design.
Implementation caution: AIOps provides likely causes, not certainty. Human validation remains important, especially for high-impact incidents.
4. Fragmented observability across hybrid environments
Problem: Many organisations use a mix of on-premises systems, private cloud, public cloud, containers, virtual machines, databases, networks, and SaaS applications. Each layer may produce telemetry in a different format.
Why it is difficult: Teams may need to switch between multiple dashboards and tools to understand one incident. Without a shared view, they cannot easily see how an application issue relates to infrastructure or network health.
How AIOps helps: AIOps can consolidate telemetry from multiple sources into a unified operational view. It supports cross-domain correlation, service dependency mapping, unified incident timelines, contextual search, distributed tracing, infrastructure and application correlation, and multi-cloud visibility.
Technical example: A customer-facing application slows down. AIOps links frontend latency to a Kubernetes service, a database query, a network path, and a recent cloud configuration change.
Operational benefit: Teams gain a shared view of an incident across application, infrastructure, and network domains.
Implementation caution: AIOps cannot compensate for incomplete instrumentation. Teams must ensure adequate telemetry coverage across critical services.
5. Capacity planning and resource bottlenecks
Problem: Capacity problems often appear as performance degradation before a complete outage. CPU saturation, memory pressure, disk I/O bottlenecks, network congestion, GPU utilisation, database connection limits, and storage exhaustion can all degrade service quality.
Why it is difficult: Capacity is dynamic. Workloads change with business cycles, product launches, seasonal demand, and new application releases.
How AIOps helps: AIOps can use historical data and forecasting to predict capacity needs. A simple forecasting concept is:
y^t+h=f(yt,yt−1,…,yt−n)\widehat{y}_{t+h} = f(y_t, y_{t-1}, \ldots, y_{t-n})yt+h=f(yt,yt−1,…,yt−n)
The model uses past usage patterns to estimate future demand. In practice, forecasts must account for seasonality, promotions, product launches, and infrastructure changes.
Technical example: AIOps identifies that a Kubernetes cluster consistently approaches its memory limit before month-end batch processing. It recommends capacity review before the next cycle.
Operational benefit: Teams can plan capacity before saturation affects users.
Implementation caution: Forecasts are estimates, not guarantees. They should be reviewed against business plans and validated with real workload data.
6. Performance degradation in applications
Problem: Users may experience slow applications even when servers appear healthy. Latency, error rates, throughput, saturation, database query performance, API response time, frontend performance, third-party dependencies, queue backlog, and cache misses can all affect user experience.
Why it is difficult: A single user complaint does not identify the failing layer. The issue may be in the frontend, application, database, network, or an external service.
How AIOps helps: AIOps correlates user experience with backend telemetry to identify the layer causing degradation.
Two useful frameworks are:
- RED method: Rate, Errors, Duration. It is useful for request-driven services and APIs.
- USE method: Utilisation, Saturation, Errors. It is useful for assessing infrastructure resources such as CPU, memory, disk, and network.
Technical example: An e-commerce application slows down. AIOps correlates rising frontend latency with increased database query time and a growing queue backlog, indicating a downstream database constraint rather than a web-server issue.
Operational benefit: Teams can identify the likely failing layer faster and avoid unnecessary escalation.
Implementation caution: Distributed tracing must cover the critical request path. Partial tracing can produce misleading conclusions.
7. Recurring incidents and unknown failure patterns
Problem: Repeated incidents waste engineering time and reduce confidence in the system. Teams may resolve the same issue repeatedly without addressing the underlying weakness.
Why it is difficult: Similar incidents may appear under different alert names, affect different services, or occur at different times.
How AIOps helps: AIOps can identify recurring patterns, cluster similar incidents, detect known-error signatures, recommend relevant runbooks, link incidents to past resolutions, identify systemic weaknesses, and support post-incident analysis.
Technical example: AIOps identifies that memory-pressure alerts on different services follow a similar pattern after a particular batch job. It links the incidents to a known runbook and recommends a capacity or scheduling review.
Operational benefit: Teams can convert repeated firefighting into systemic improvement.
Implementation caution: AIOps should support, not replace, blameless post-incident reviews. Google’s SRE guidance describes postmortems as records of incident impact, mitigation, root causes, and follow-up actions, with a focus on learning rather than assigning blame.cloud.google+1
Problem: Many incidents begin after a deployment, configuration change, patch, or infrastructure update. Configuration drift, infrastructure-as-code changes, Kubernetes manifest changes, network policy updates, database schema changes, security patches, and third-party API changes can all introduce risk.
Why it is difficult: Change data often lives in separate systems from monitoring and incident data. Teams may not immediately connect a new incident to a recent release.
How AIOps helps: AIOps can correlate telemetry with change events to identify whether a recent change is associated with degradation.
A simple change-risk concept is:
Change risk=f(scope,blast radius,historical failure rate,environment)
Technical example: Shortly after a Kubernetes manifest change, error rates rise in one service. AIOps correlates the change with the incident and highlights the affected deployment in the incident timeline.
Operational benefit: Teams can prioritise changes for closer monitoring and respond faster when a release causes degradation.
Implementation caution: AIOps can help prioritise changes for closer monitoring, but it cannot eliminate the need for change management.
9. Security and operational risk signals
Problem: Security events often show operational symptoms before they are formally investigated: unusual authentication failures, abnormal API traffic, unexpected privilege escalation, configuration anomalies, suspicious outbound traffic, or resource exhaustion.
Why it is difficult: Security and IT operations teams often use separate tools. Operational anomalies may be treated as performance issues, while security teams may not have immediate infrastructure context.
How AIOps helps: AIOps can improve operational awareness of security-relevant events by correlating unusual traffic, authentication failures, configuration changes, and resource-exhaustion patterns.
Technical example: AIOps detects a sudden rise in failed authentication attempts followed by unusual outbound traffic from a specific workload. It enriches the incident with affected hosts, recent changes, and related alerts.
Operational benefit: Security and operations teams can share context earlier and respond more coherently.
Implementation caution: AIOps should complement, not replace, SIEM, SOAR, XDR, identity security, and vulnerability-management platforms.
10. Manual, repetitive operational tasks
Problem: IT teams spend substantial time on repetitive tasks such as triage, ticket creation, log searching, escalation, and routine remediation.
Why it is difficult: These tasks are necessary, but they consume engineering time and introduce inconsistency when performed manually under pressure.
How AIOps helps: AIOps can automate alert enrichment, ticket routing, runbook execution, health checks, log retrieval, diagnostic data collection, incident summaries, post-incident reporting, capacity recommendations, and routine remediation.
Technical example: When a service becomes unavailable, AIOps automatically collects recent logs, identifies the affected deployment, creates a ticket, assigns it to the correct team, and recommends a documented rollback runbook.
Operational benefit: Engineers spend less time on manual coordination and more time on higher-value work.
Implementation caution: Automation must include approval workflows, role-based access controls, audit logs, rollback plans, and guardrails for production systems.
Uptime Institute’s 2025 Annual Outage Analysis found that nearly 40% of organisations had suffered a major outage caused by human error over the previous three years, and that 85% of those incidents stemmed from staff failing to follow procedures or from flaws in the procedures themselves. This reinforces why automation needs guardrails, approvals, and clear operational procedures.
AIOps benefits across the incident lifecycle
|
Operational stage |
Traditional challenge |
AIOps capability |
Business benefit |
|
Detection |
Alerts arrive late or are missed |
Anomaly detection and real-time analysis |
Faster awareness of service risk |
|
Triage |
Too many alerts and manual correlation |
Event correlation and noise reduction |
Less alert fatigue |
|
Diagnosis |
Root cause takes hours |
Topology-aware analysis and evidence gathering |
Faster resolution |
|
Remediation |
Manual, repetitive actions |
Runbook automation and guided workflows |
Reduced operational effort |
|
Prevention |
Capacity issues are discovered late |
Forecasting and capacity analytics |
Better planning |
|
Improvement |
Lessons are not reused |
Pattern recognition and incident intelligence |
Fewer repeat incidents |
What AIOps cannot solve alone
AIOps does not automatically fix poor architecture, weak observability, bad data quality, unclear ownership, or weak change management.
AIOps needs:
- Complete and reliable telemetry.
- Well-maintained service dependencies.
- Clear ownership and escalation paths.
- Standardised incident workflows.
- Accurate configuration and asset data.
- Secure integrations.
- Human review for high-risk actions.
- Continuous model validation.
- Clear success metrics.
Organisations should avoid treating AIOps as a “set-and-forget” solution. Models, thresholds, correlations, and automation workflows need ongoing review as systems, traffic patterns, and business requirements change.
How Cyfuture Cloud supports AIOps-ready infrastructure
Cyfuture Cloud can help organisations build an operational foundation for AIOps through cloud infrastructure provisioning, hybrid and multi-cloud workload support, monitoring and observability integration, centralised log and metric collection, infrastructure performance monitoring, incident-management workflows, automation and orchestration, security and governance, capacity planning, technical consultation, and managed cloud operations.
Cyfuture Cloud positions itself as an infrastructure and operations partner that can help organisations improve visibility, reliability, automation, and operational maturity across cloud and IT environments.
AIOps adoption roadmap
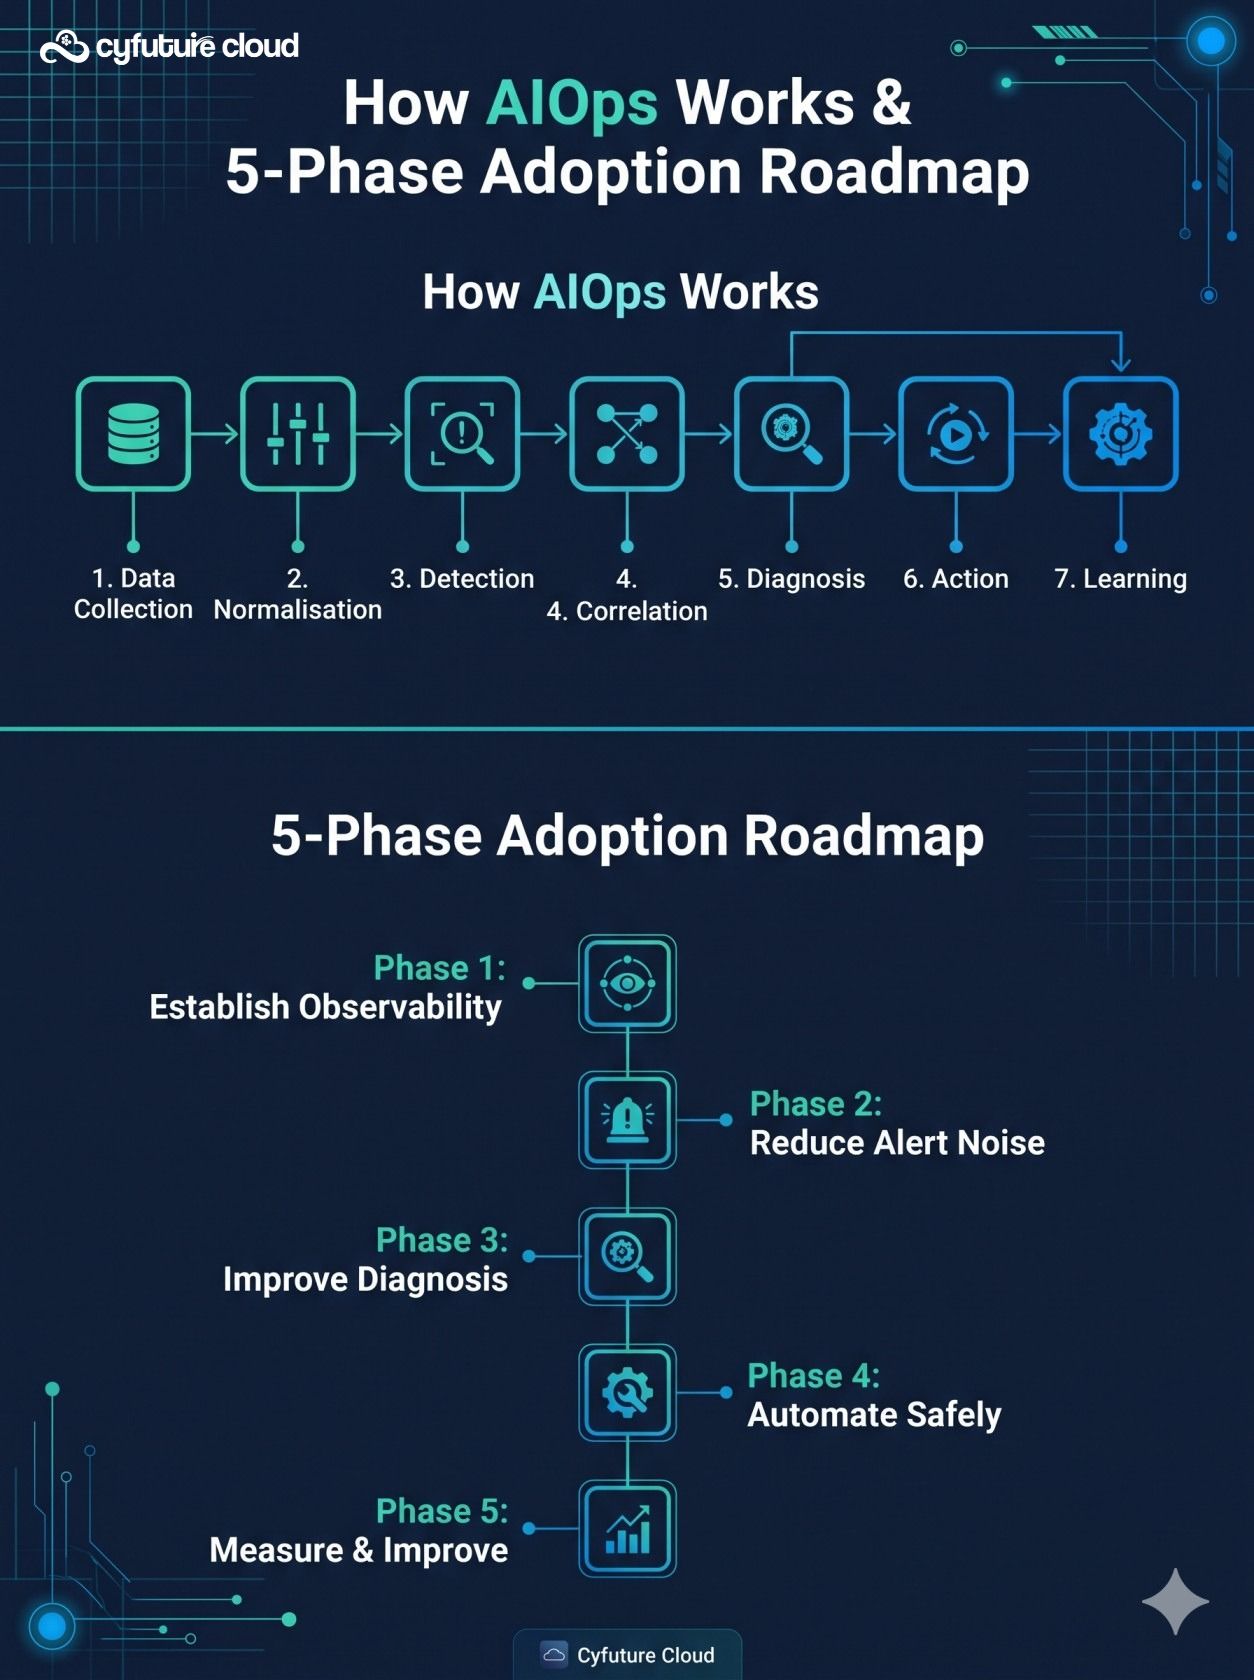
Phase 1: Establish observability
- Inventory critical services and dependencies.
- Standardise metrics, logs, and traces.
- Centralise telemetry.
- Define service ownership.
- Establish baseline performance.
Phase 2: Reduce alert noise
- Remove duplicate and low-value alerts.
- Create severity and routing rules.
- Correlate related events.
- Establish on-call workflows.
- Measure alert volume and noise.
Phase 3: Improve diagnosis
- Build dependency maps.
- Correlate changes with incidents.
- Enable distributed tracing.
- Create incident timelines.
- Standardise post-incident reviews.
Phase 4: Automate safely
- Start with low-risk workflows.
- Add approval and rollback controls.
- Test automation in non-production environments.
- Maintain audit logs.
- Expand automation gradually.
Phase 5: Measure and improve
- Track MTTD, MTTR, alert volume, incident recurrence, availability, and change failure rate.
- Review model accuracy.
- Update runbooks.
- Continuously improve telemetry and workflows.
Metrics to track
|
Metric |
What it measures |
Why it matters |
|
MTTD |
Time taken to detect an issue |
Faster detection reduces impact |
|
MTTR |
Time taken to restore service |
Faster recovery improves availability |
|
Alert volume |
Number of alerts generated |
High volume can overwhelm teams |
|
Alert noise ratio |
Non-actionable alerts as a share of total alerts |
Lower noise improves focus |
|
Incident recurrence rate |
Frequency of repeated incidents |
Indicates systemic weaknesses |
|
Change failure rate |
Percentage of changes causing incidents |
Helps assess release quality |
|
Service availability |
Percentage of time a service meets availability targets |
Directly affects user experience |
|
SLO attainment |
Whether services meet reliability objectives |
Connects operations to business outcomes |
Teams should establish a baseline before deploying AIOps, then measure improvement over time. Results depend on tooling, data quality, workload complexity, and operational maturity.
FAQs
What is AIOps in simple terms?
AIOps is the use of AI, machine learning, analytics, and automation to help IT teams manage operational data, detect problems, identify likely causes, and respond faster.
How does AIOps reduce alert fatigue?
It groups related alerts, removes duplicates, applies context, scores severity, and suppresses low-value notifications. This helps teams focus on actionable incidents rather than individual alerts.
Can AIOps automatically fix IT incidents?
Sometimes, but only for well-defined, low-risk workflows. Automated remediation should include approvals, role-based access controls, audit logs, rollback plans, and guardrails for production systems.
What data does AIOps need?
AIOps needs metrics, logs, traces, events, alerts, configuration data, dependency maps, change records, incident tickets, and user-experience data. Data quality and coverage matter as much as the AI model.
How does AIOps improve MTTR?
It correlates related signals, surfaces likely root causes, provides incident context, and can trigger guided or automated remediation. This can reduce time spent searching across tools, although results depend on telemetry and workflow design.
Is AIOps useful for hybrid and multi-cloud environments?
Yes. AIOps can consolidate telemetry from on-premises, private cloud, public cloud, containers, virtual machines, databases, networks, and SaaS services into a more unified operational view.
What are the limitations of AIOps?
AIOps cannot compensate for poor architecture, incomplete instrumentation, bad data quality, unclear ownership, or weak change management. It also requires human oversight for high-risk decisions.
How can organisations start implementing AIOps?
Start by establishing observability, reducing alert noise, improving diagnosis, automating low-risk workflows, and measuring results against a pre-AIOps baseline.
Conclusion
AIOps benefits are most visible where operational complexity is highest: hybrid cloud, Kubernetes, distributed applications, and AI-intensive workloads. By turning fragmented telemetry into correlated, actionable insight, AIOps helps teams detect issues earlier, diagnose them faster, and automate routine response with appropriate guardrails.
The value of AIOps comes from combining AI with strong operational foundations: reliable telemetry, clear ownership, tested runbooks, secure automation, and continuous measurement. Organisations that treat AIOps as part of a broader reliability programme are more likely to realise durable improvements than those that expect a platform alone to solve operational problems.
Technical review note: This article is intended for general informational purposes. AIOps outcomes depend on data quality, integration, workflow design, tooling, and operational maturity. Organisations should validate performance improvements against their own environment before making investment decisions.
Looking to improve visibility, reliability, and operational efficiency across your cloud and IT infrastructure? Speak with Cyfuture Cloud specialists to assess your observability, automation, and AIOps readiness.













Stay Ahead of the Curve.
Join the Cloud Movement, today!
Send this to a friend