Get 69% Off on Cloud Hosting : Claim Your Offer Now!


- Products
- Solutions
-
Solutions
-
 Cloud
Hosting
-
VPS
Hosting
-
 GPU
Cloud
-
 Dedicated
Server
-
 Server
Colocation
-
 Backup as a Service
-
 CDN
Network
-
 Window
Cloud Hosting
-
 Linux
Cloud Hosting
-
Managed
Cloud Service
-
 Storage
as a Service
-
VMware
Public Cloud
-
Multi-Cloud
Hosting
-
Cloud
Server Hosting
-
Bare
Metal Server
-
Virtual
Machine
-
 Magento
Hosting
-
 Remote
Backup
-
 DevOps
-
 Kubernetes
-
 Cloud
Storage
-
 NVMe
Hosting
-
 DR
as s Service
-
-
Solutions
- Marketplace
- Pricing
- Resources
- Company
 Remote
Backup
 NVMe
Hosting
 Pricing
Calculator
 Unlock Cost
Optimization
 Overview
 Documentation
 Price
Calculator
 Tools
 FAQs
 Terms
of Service
 Privacy
Policy
 Migration
 Container
 Power
 Utilities
 VMware
Private Cloud
 VMware
on AWS
 VMware
on Azure
 Certifications
 Partners
 Careers
 Support
 Service
Level Agreement
 Contact
Table of Contents
- What is real-time AI monitoring?
- Batch versus real-time monitoring
- Why AI models degrade over time
- What should be monitored?
- Real-time monitoring architecture
- Alerting and incident response
- Automated response and MLOps
- Real-time monitoring for generative AI
- Business impact of real-time monitoring
- Common monitoring challenges
- AI monitoring best practices
- Real-Time AI Monitoring with Cyfuture Cloud
- Real-time AI monitoring deployment checklist
- An illustrative example
- Conclusion
An AI model that scored well in testing can behave very differently six months after launch. Customer behaviour shifts, upstream systems change, data pipelines break quietly, and infrastructure comes under load that nobody simulated. The model file is the same, but the conditions around it are not.
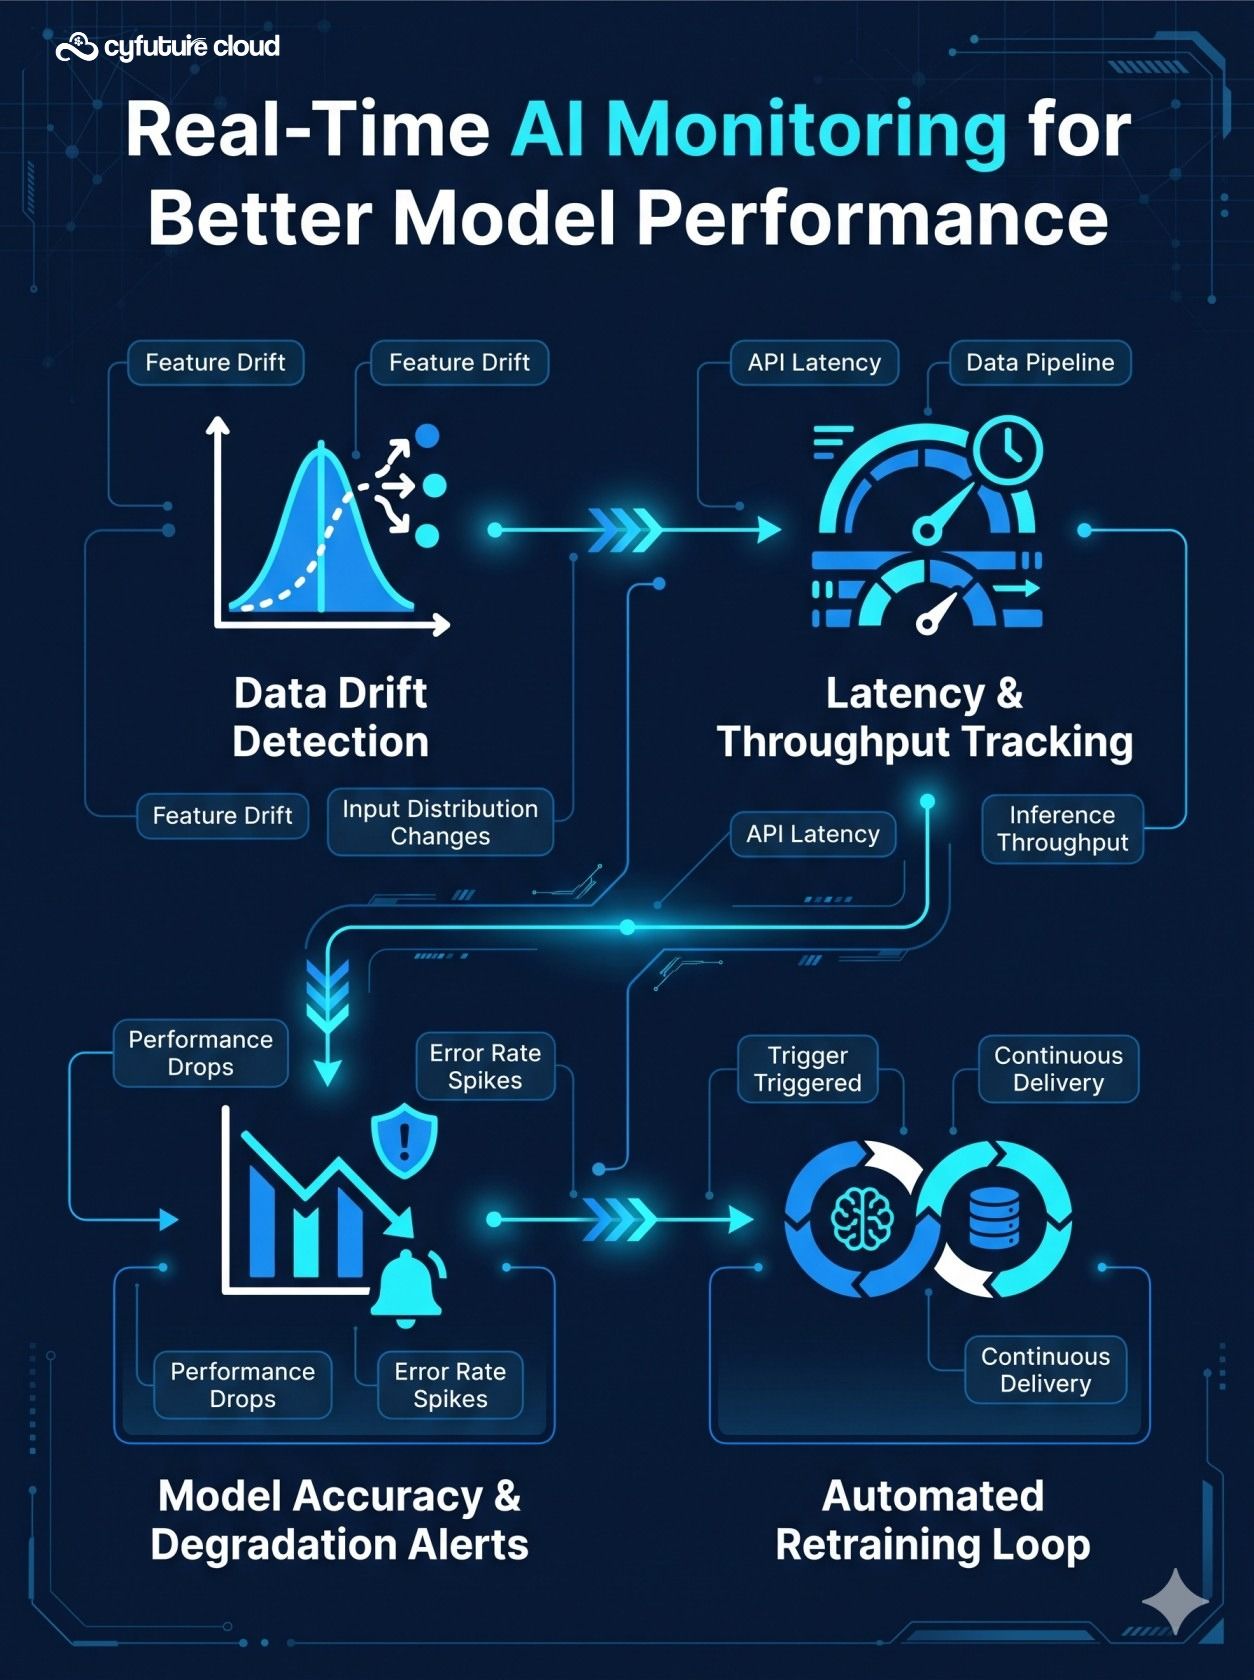
Real-time AI monitoring is the continuous collection and analysis of signals from an AI system while it is running. Its purpose is to surface problems quickly enough for teams to act before customers or business processes feel the impact. Done well, it helps organisations keep AI systems reliable, secure and high-performing. This article explains what to monitor, how to structure the monitoring architecture, and where automation should stop and human judgement should begin.
What is real-time AI monitoring?
Real-time AI monitoring is the continuous observation of:
- Model inputs: the features and prompts that reach the model.
- Model outputs: predictions, scores, generated text and their distributions.
- Prediction quality: how correct or useful outputs are, measured against ground truth where available.
- Infrastructure performance: GPU, CPU, memory, network and storage behaviour.
- User interactions: requests, feedback, overrides and abandonment.
- Operational costs: compute, storage and data-transfer spend.
- Security and compliance signals: access patterns, policy violations and audit records.
This is broader than traditional application monitoring. A service can return HTTP 200 on every call and still produce poor predictions. Machine learning monitoring has to watch both whether the system is running and whether it is right.
Batch versus real-time monitoring
Batch monitoring analyses data periodically, for example a nightly drift report or a weekly accuracy review. It suits slow-moving signals and low-risk use cases.
Real-time monitoring analyses events continuously or near-continuously as they occur. It suits signals where delay is costly, such as latency spikes, error bursts, fraud-score shifts or guardrail violations.
“Real time” does not always mean instantaneous. In production AI it usually means detection latency low enough to support timely response. A fraud system may need alerts within seconds, while a demand-forecasting model may be well served by hourly checks. Most mature setups combine both modes.
Why AI models degrade over time
A model learns patterns from historical data. Production data keeps moving. The main causes of degradation are:
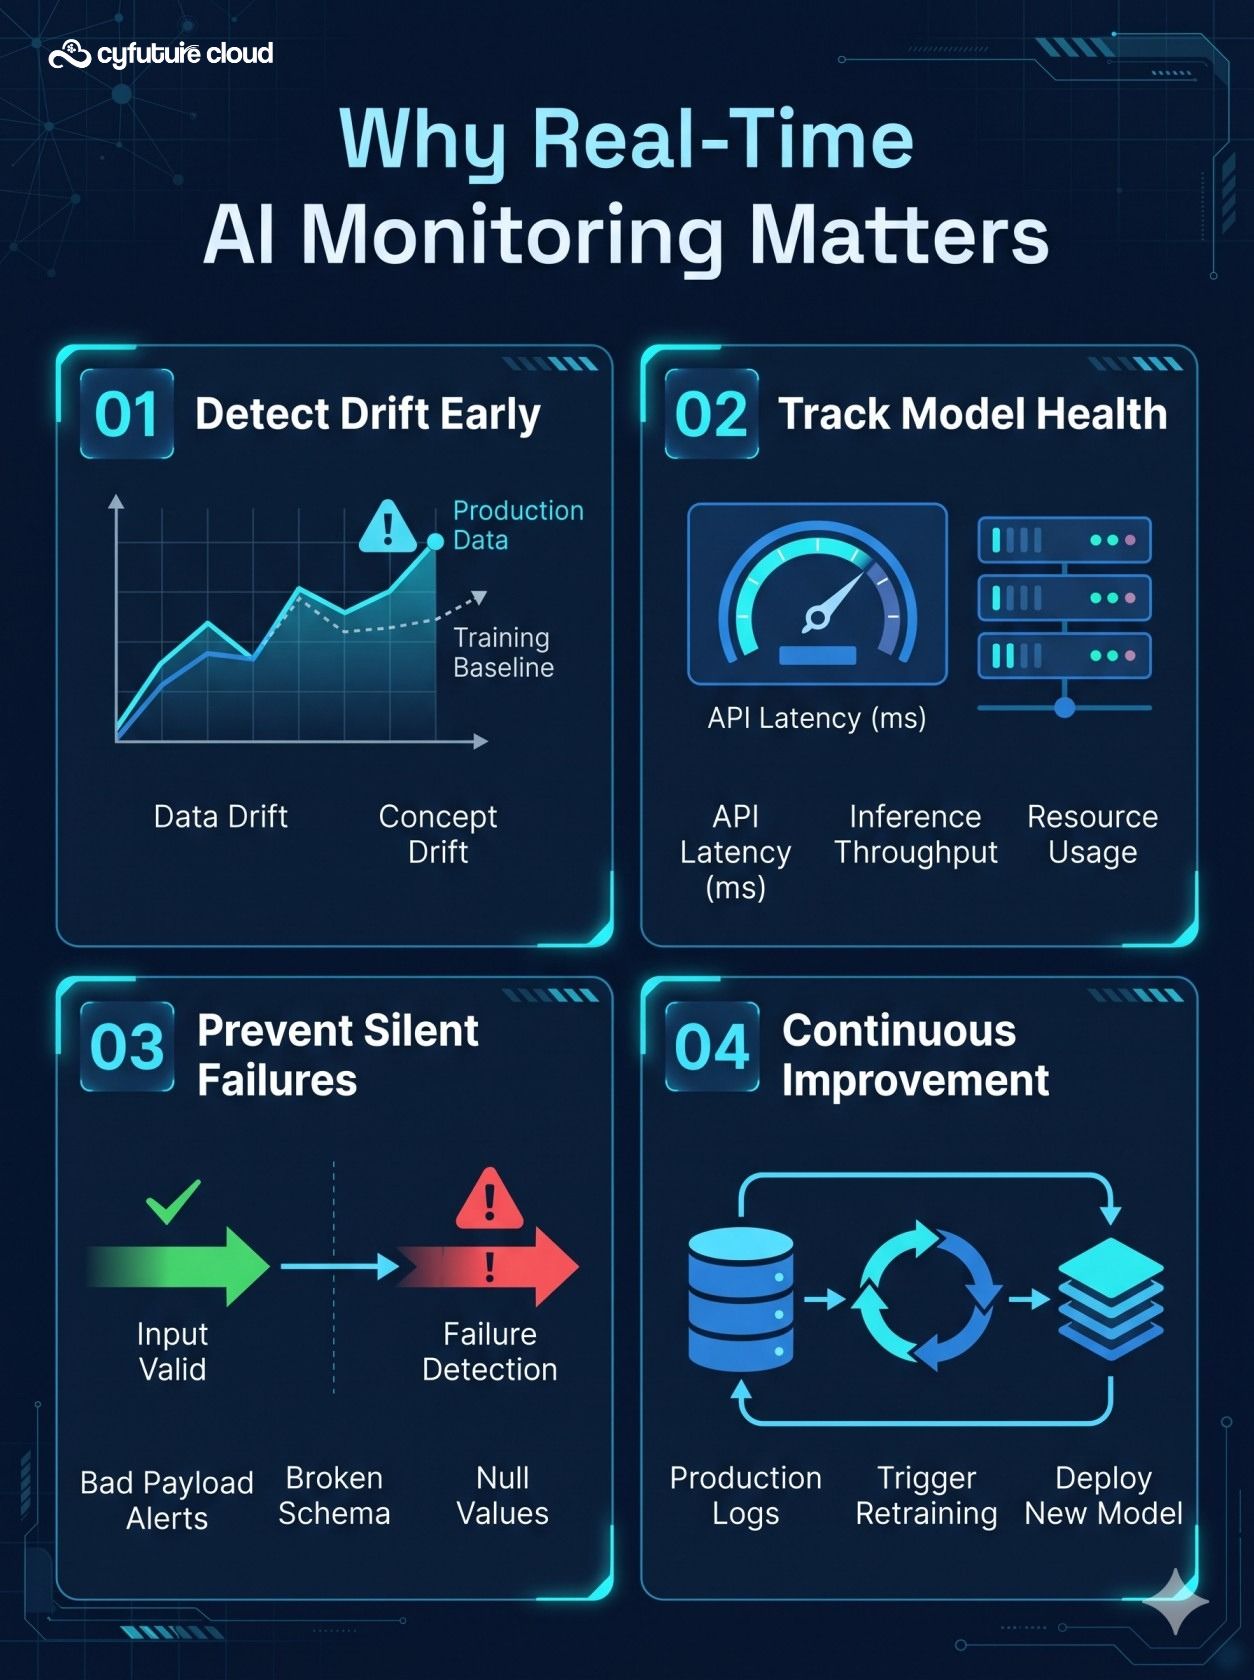
- Data drift: the statistical distribution of input data changes.
- Concept drift: the relationship between inputs and the correct output changes.
- Model decay: prediction quality declines as the model becomes less aligned with current conditions. Drift is a common cause, not the only one.
- Feature drift: the distribution of an individual input feature changes, for example average basket value rising after a pricing change.
- Label drift: ground-truth labels or their definitions change, such as a revised policy on what counts as a “valid claim”.
- Data quality issues: missing, delayed, duplicated, corrupted or biased data.
- Upstream changes: an API, schema or application release alters what the model receives.
- Infrastructure issues: GPU saturation, memory pressure, network congestion or slow storage.
A simple example. Consider a fraud-detection model trained on past transaction patterns. Fraudsters adapt, and new tactics look different from the training data. Recall falls and missed fraud rises. The model has not necessarily failed. The world it was trained on has changed, and only monitoring tells the team that this has happened.
What should be monitored?
Model performance
Track the metrics that match the use case:
- Accuracy: share of correct predictions.
- Precision: of the items flagged positive, how many truly were.
- Recall: of the true positives, how many were found.
- F1 score: the harmonic mean of precision and recall.
- AUC-ROC: how well the model separates classes across thresholds.
- Mean absolute error (MAE) and root mean squared error (RMSE): average size of errors in regression tasks. RMSE penalises large errors more.
- Confidence scores and prediction distribution: whether outputs are shifting even before labels arrive.
- False positives and false negatives: tracked separately, because their costs differ.
- Business-specific outcomes: chargeback rates, conversion, handling time.
The right metric depends on the use case. Fraud detection may prioritise recall to reduce missed fraud, while watching precision so genuine customers are not blocked. Medical decision support needs careful evaluation of both false negatives and false positives, with clinical oversight. Recommendation systems focus on engagement, conversion and relevance. Generative AI needs human evaluation, safety checks and quality scoring.
Accuracy alone is misleading when classes are imbalanced. If only 0.5% of transactions are fraudulent, a model that labels everything as legitimate is 99.5% accurate and useless.
Data quality
A model can fail because of poor input data even when the model itself is unchanged. Monitor for:
- Missing and null values, duplicate records, outliers and corrupted records.
- Schema changes, data type mismatches and invalid values.
- Inconsistent units, such as rupees against paise, or Celsius against Fahrenheit.
- Delayed data and data freshness, meaning how old the newest record is.
- Feature availability and source-system failures.
Quality checks at the pipeline entry point are often the cheapest defence, because bad data is stopped before it reaches the model.
Data drift and concept drift
Data drift means input distributions have changed. Concept drift means the same inputs now imply a different correct answer. Data drift can occur without hurting accuracy, and concept drift can occur without any visible change in inputs, which is why both need watching.
Teams commonly use statistical tests, distance metrics between distributions (such as population stability index or divergence measures), feature-level comparisons and business-outcome tracking. Concept drift is harder to see in real time because it usually requires ground-truth labels, which may arrive late.
Drift detection should not automatically trigger retraining. Teams should investigate the cause, assess business impact, validate the new data, and test a candidate model before deployment. Retraining on corrupted or temporarily unusual data can make things worse.
Inference performance
Inference metrics shape user experience directly:
- Latency: time taken to process one request. Track percentiles (p50, p95, p99), not just averages.
- Throughput: requests processed over a period, often expressed as requests per second.
- Availability: percentage of time the service is accessible and functioning, usually tied to a service level objective (SLO), which is a measurable reliability target.
- Error rate, timeout rate, retry rate, queue depth and concurrency.
- For generative AI: tokens per second and time to first token.
- GPU and memory utilisation, and cache hit rate.
End-to-end latency is the sum of its parts:
End-to-end latency = network time + preprocessing time + inference time + postprocessing time
Optimising only model inference may not help if data retrieval, network hops or post-processing dominate. Measure each stage, ideally through distributed tracing, before deciding where to invest.
Infrastructure and GPU health
For AI infrastructure monitoring, track GPU utilisation, GPU memory, temperature, power draw and thermal throttling, along with network bandwidth, storage I/O, CPU utilisation, container health, Kubernetes pod status, job failures, retry patterns, autoscaling events and resource contention.
High GPU utilisation is not automatically good. A GPU at 95% with growing queue depth and rising latency is saturated. A GPU at 40% with low throughput may be starved by a slow data loader or storage. Always read GPU monitoring alongside throughput, latency, queue depth and job completion rate. NVIDIA’s DCGM documentation describes the GPU-level metrics available on supported hardware.
Cost monitoring
Cost is an operational signal, not just a finance report. Track compute cost per request, cost per inference, cost per training run, GPU idle time, over-provisioning and under-utilisation, data-transfer and storage costs, model-serving costs, cost per customer or tenant, and cost anomalies. A sudden jump in cost per request can point to a runaway retry loop, longer prompts or an inefficient model version. Cost visibility helps teams balance performance, availability and efficiency.
Security and governance
AI governance depends on evidence. Monitor for unauthorised access and access-control failures, abnormal request patterns, prompt-injection attempts (where relevant), data leakage and sensitive-data exposure, model-extraction attempts, policy violations, model-output safety issues and audit-log completeness.
The NIST AI Risk Management Framework (AI RMF 1.0, January 2023) frames AI risk management around the functions Govern, Map, Measure and Manage, and NIST’s Generative AI Profile (NIST AI 600-1, July 2024) extends it to generative systems. Monitoring supplies the measurements these functions rely on. It does not replace human review, governance policies or formal risk assessments.
Real-time monitoring architecture
A practical architecture covers six layers:
|
Layer |
What it monitors |
Example signals |
|
Data layer |
Input data quality and freshness |
Missing values, schema changes, delayed records |
|
Model layer |
Prediction quality and behaviour |
Accuracy, confidence, drift, output distribution |
|
Serving layer |
API and inference performance |
Latency, throughput, errors, queue depth |
|
Infrastructure layer |
Compute and platform health |
GPU utilisation, memory, temperature, network |
|
Business layer |
Commercial outcomes |
Conversion, revenue impact, customer satisfaction |
|
Security layer |
Risk and compliance |
Access anomalies, policy violations, audit trails |
The monitoring flow:
- Collect telemetry from applications, models, infrastructure and data pipelines.
- Standardise and enrich it, for example by tagging model version, region and tenant.
- Store metrics, logs and traces.
- Apply thresholds, anomaly detection and alerting rules.
- Visualise on dashboards.
- Trigger alerts or automated actions.
- Investigate, remediate and improve.
AI observability builds on the three pillars of observability, as described in OpenTelemetry’s documentation: metrics (numerical measurements over time), logs (timestamped event records) and traces (the path of a request across services). For AI systems, these are extended with model-specific signals: predictions, feature distributions, drift scores and evaluation results. Linking a prediction to its trace and model version is what makes root-cause analysis practical.
Alerting and incident response
Alerts should be actionable, not noisy. Common techniques include:
- Static thresholds: fixed limits, such as p95 latency above a set value.
- Dynamic thresholds: limits that adapt to time of day or seasonality.
- Anomaly detection: flags unusual behaviour without a hand-set limit.
- Rate-based alerts: trigger on the speed of change, such as error rate doubling in five minutes.
- Composite alerts: combine signals, for example rising latency and falling retrieval relevance, to reduce false alarms.
A good alert answers five questions: What happened? Which model or service is affected? How severe is it? Which users or business processes are impacted? What should the on-call team do first?
Support alerts with severity levels, named on-call ownership, escalation paths, runbooks, incident timelines and post-incident reviews. Beware of alert fatigue. When teams receive too many low-value alerts, they start ignoring all of them, including the critical ones.
Automated response and MLOps
MLOps monitoring connects detection to action. Typical mechanisms include:
- Canary deployment: release a new version to a small share of traffic first.
- Shadow deployment: run a new model on live traffic without serving its output.
- A/B testing and traffic splitting: compare versions on real outcomes.
- Automated rollback: revert to a previous model version.
- Model versioning and registry integration: know exactly what is running.
- Data validation gates, retraining pipelines, approval workflows and continuous evaluation.
- Feature-store monitoring: catch inconsistencies between training and serving features.
Use automation carefully. Automated rollback may be appropriate for a severe latency or availability issue. Retraining, by contrast, should usually include validation and human approval, because an unreviewed retrain can propagate bad data into production.
Real-time monitoring for generative AI
Generative AI needs everything above plus quality signals that are harder to measure:
- Prompt and response quality, including human evaluation and scoring.
- Hallucination detection: identifying fluent but unsupported statements.
- Groundedness: whether the answer is supported by retrieved content, and retrieval relevance in retrieval-augmented generation (RAG).
- Safety and toxicity checks, guardrail violations, PII exposure and prompt-injection detection.
- Token usage and cost per request, latency and time to first token.
- Model refusal rate and user feedback.
A fast response is not useful if it is inaccurate, unsafe or irrelevant. Automated evaluators, including model-based judges, can flag likely problems at scale, but they are imperfect and should be calibrated against human review. Monitoring can reduce the risk of hallucinations reaching users. It cannot guarantee their detection.
Business impact of real-time monitoring
Because results depend on the organisation, these are possible benefits, not guaranteed outcomes. Monitoring can help support:
- Better customer experience and reduced downtime.
- Faster issue resolution and more reliable AI decisions.
- Improved model quality and lower operational risk.
- Better resource utilisation and more controlled AI spend.
- Stronger governance evidence and faster innovation cycles, since teams can release changes with more confidence.
Common monitoring challenges
- Too many metrics and poorly defined thresholds, leading to alert fatigue.
- Lack of ground-truth labels and delayed feedback, which slow quality measurement.
- Complex distributed systems and multi-model environments.
- Data privacy constraints on what can be logged.
- Cost of storing telemetry at scale.
- Difficulty correlating infrastructure and model issues.
- Unclear ownership between data, ML and platform teams.
Successful monitoring depends on clear ownership, prioritisation and collaboration across these teams.
AI monitoring best practices
- Define business and technical KPIs before deployment.
- Monitor data, model, infrastructure, cost and security together.
- Use baselines from validation data and early production data.
- Start with high-impact signals, and avoid giving every metric the same detail.
- Set actionable alert thresholds.
- Build dashboards for different audiences: engineers, product owners and executives.
- Maintain audit trails.
- Version models, datasets and monitoring rules.
- Test the monitoring system itself before rollout, for example by injecting synthetic drift or failures.
- Conduct regular model reviews.
- Combine automated monitoring with human evaluation, and require human review for high-risk decisions.
- Establish clear incident ownership.
- Review monitoring rules after every major incident.
- Align monitoring with responsible-AI policies.
Real-Time AI Monitoring with Cyfuture Cloud
Reliable AI depends on more than model code. It depends on the infrastructure and operations beneath it. Cyfuture Cloud can act as an infrastructure and operations partner for teams running AI workloads, helping them build the foundations that real-time AI monitoring relies on:
- Scalable GPU infrastructure for training and inference workloads.
- Managed cloud operations to reduce the operational burden on internal teams.
- Monitoring and observability support. Monitoring tools supported. Observability integrations
- Infrastructure performance tracking. GPU monitoring capabilities
- Security and access controls. Security controls: [Insert approved details]
- Data and workload governance aligned to customer policies.
- Cost visibility for compute and storage usage.
- Technical consultation and AI workload optimisation to match infrastructure to model and traffic patterns.
Real-time AI monitoring deployment checklist
- Define the AI use case and success metrics.
- Identify critical model, data and infrastructure signals.
- Establish performance baselines.
- Set alert thresholds and severity levels.
- Build dashboards for technical and business users.
- Define incident ownership and escalation paths.
- Test monitoring before production launch.
- Monitor data quality and drift.
- Track latency, throughput, errors and availability.
- Monitor GPU, memory, network and storage usage.
- Track cost and resource efficiency.
- Enable audit logs and security monitoring.
- Review alerts and dashboards regularly.
- Document incident-response procedures.
- Continuously improve monitoring rules.
An illustrative example
This is a hypothetical scenario for explanation. It is not a verified customer case study.
An enterprise deploys a generative AI assistant for customer support. Its monitoring tracks latency, token usage, retrieval relevance, response quality, guardrail violations and customer feedback. One afternoon, response latency rises while retrieval relevance falls. A composite alert fires, and the platform team traces the latency to slow storage reads behind the vector index. Inspecting retrieval logs, they also find that the knowledge index has not been refreshed after a product update. The team fixes the storage issue and refreshes the index, restoring latency and relevance before customer satisfaction scores decline significantly. Without correlated monitoring, the two problems might have been blamed on the model.
Conclusion
AI systems change in production because their environment changes. Real-time AI monitoring gives teams the visibility to see those changes early, across data, models, infrastructure, cost and security, and to respond with discipline: rollback where it is safe, retrain only after validation, and escalate to humans where stakes are high. Start with the signals that matter most to your use case, assign clear ownership, and refine your rules after each incident.






Stay Ahead of the Curve.
Join the Cloud Movement, today!
Send this to a friend