 Server
Colocation
 CDN
Network
 Linux Cloud
Hosting
 VMware Public
Cloud
 Multi-Cloud
Hosting
 Cloud
Server Hosting
 Kubernetes
 API Gateway


A Virtual Private Server (VPS) is a powerful and flexible hosting solution that offers dedicated resources in a virtualized environment. Many website owners, developers, and businesses rely on managed VPS hosting for better performance, security, and control compared to shared hosting. However, monitoring the status of your VPS is essential to ensure it runs smoothly and efficiently. Knowing how to check your managed VPS status helps you identify potential issues like downtime, resource overutilization, and security vulnerabilities.
In this article, we will explore various ways to check the status of your managed VPS, including accessing server statistics, monitoring resource usage, and keeping track of uptime and performance.
Most hosting providers offer a dedicated control panel or dashboard where you can manage your VPS and check its status. Popular hosting control panels include cPanel, Plesk, and custom dashboards created by your hosting company.
Here’s how you can check the status of your managed VPS using your hosting provider’s control panel:

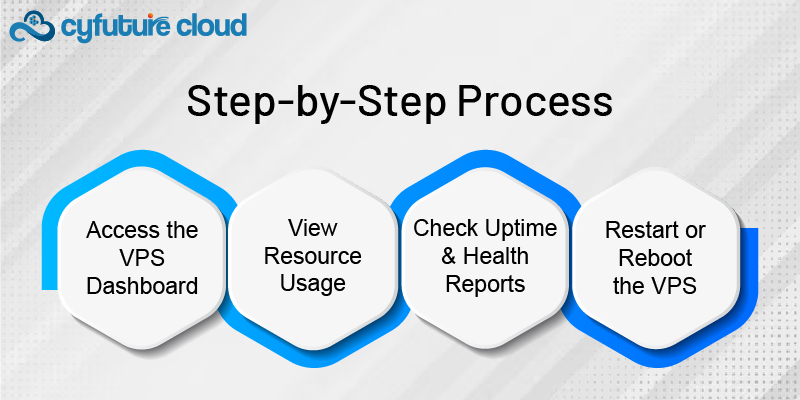
Log into Your Hosting Account: Start by logging into your hosting provider’s account using the credentials provided during the setup of your VPS.
Access the VPS Dashboard: Navigate to the VPS section in the hosting control panel. This is usually labeled as "My VPS," "VPS Management," or something similar.
View Resource Usage: In the dashboard, you should find key metrics related to your VPS, such as CPU usage, memory (RAM) usage, disk space, and network traffic. This gives you a real-time snapshot of your VPS’s performance.
Check Uptime and Health Reports: Most control panels display uptime statistics and server health information. If your cloud hosting provider offers additional monitoring tools, you may also find logs of past events like reboots, downtimes, and security alerts.
Restart or Reboot the VPS: If you notice performance issues, you can manually restart or reboot your VPS directly from the control panel. This is often located under "Actions" or "Manage VPS" options.
If you're using cPanel or Plesk, you can go to the server statistics or resource usage section to see real-time data on CPU, RAM, and disk space. Some hosting providers also integrate server monitoring tools like New Relic or Nagios into the control panel.
For more advanced users or those with root access to their managed VPS, you can directly check the status of your server using SSH (Secure Shell). SSH allows you to connect securely to your server’s command line interface, giving you detailed control and monitoring capabilities.

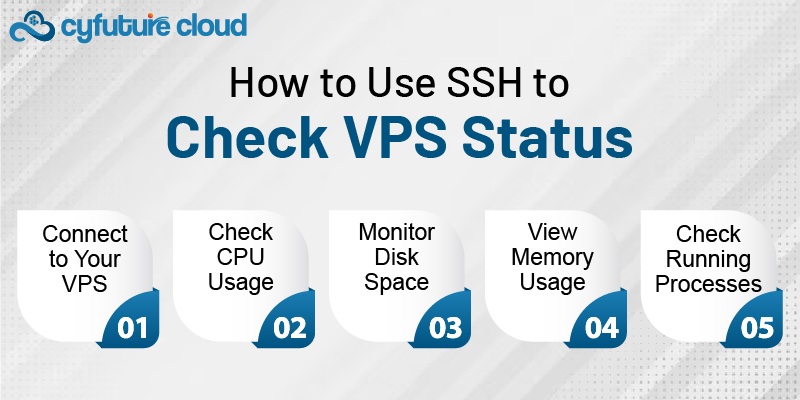
Connect to Your VPS:
Open your terminal (for macOS/Linux) or a tool like PuTTY (for Windows).
Run the following command to connect to your VPS:
ssh root@your_vps_ip
Replace your_vps_ip with your VPS’s actual IP address.
Check CPU Usage:
Once connected, use the top or htop command to view real-time CPU usage.
top
This command shows you a dynamic list of processes using CPU, RAM, and other resources.
Monitor Disk Space:
To check how much disk space is being used, run:
df -h
This will give you a human-readable summary of available disk space.
View Memory Usage:
To see detailed memory usage, use:
free -m
This displays how much memory is being used, free, and cached on your VPS.
Check Running Processes:
To view running processes and their resource usage, run:
ps aux
If you log in to your VPS via SSH and use the top command, you can observe which processes are using the most CPU or RAM. This can help you identify potential performance bottlenecks or rogue processes.

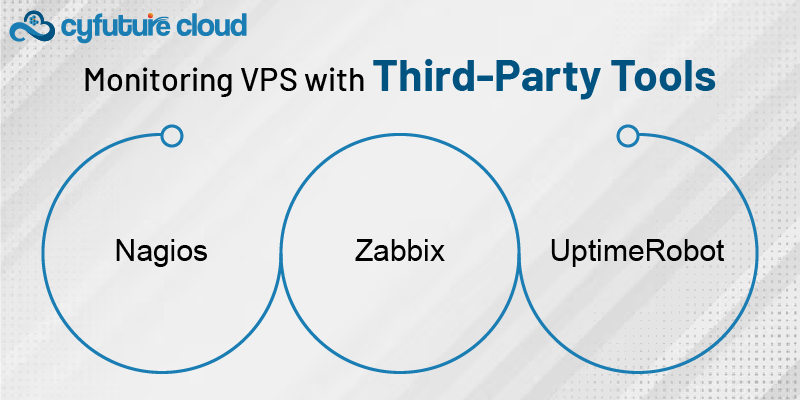
For more advanced or detailed monitoring, you can use third-party tools to keep track of your VPS status. These tools often offer features like uptime monitoring, resource usage tracking, and alerts when something goes wrong. Some popular third-party monitoring tools include:
Nagios is a comprehensive monitoring tool that helps you monitor your entire IT infrastructure, including VPS. It allows you to track system metrics, including CPU load, disk usage, and network bandwidth.
Zabbix is another open-source monitoring tool that provides detailed insights into server performance. It can track metrics like server availability, CPU and memory usage, and send alerts when predefined thresholds are exceeded.
UptimeRobot is a simple and effective tool that primarily tracks uptime. It will ping your VPS at regular intervals, and if it detects downtime, it will send alerts via email, SMS, or webhooks.

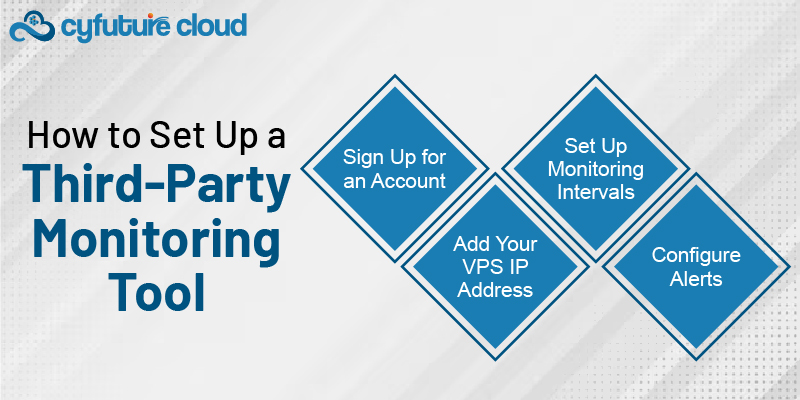
Sign Up for an Account: Start by creating an account with the monitoring service of your choice (e.g., UptimeRobot or Nagios).
Add Your VPS IP Address: Enter the IP address of your VPS to be monitored.
Set Up Monitoring Intervals: Configure how often the tool checks your VPS status (e.g., every 5 minutes).
Configure Alerts: Set up notifications, so you receive alerts via email or SMS if any issues are detected, such as downtime or high resource usage.
Some hosting providers offer API access that allows you to programmatically check the status of your VPS. This is particularly useful if you want to integrate VPS monitoring into your own application or custom scripts.
For example, with API access, you can:
Programmatically check resource usage (CPU, RAM, and disk space).
Receive real-time alerts and health reports.
Automate tasks like VPS restarts or resource allocation.
For busy website owners or developers, manually checking VPS status every day isn’t always practical. To ensure continuous monitoring without constant supervision, you can set up automated alerts that notify you when your VPS experiences issues such as high CPU usage, low disk space, or downtime.
Use a Monitoring Service: Many control panels and third-party monitoring tools allow you to set up automatic alerts.
Configure Thresholds: Define thresholds for critical metrics such as CPU usage, disk space, memory consumption, and network activity.
Receive Notifications: Choose how you want to receive notifications (e.g., email, SMS, or through a mobile app).
Monitoring the status of your managed VPS is crucial for ensuring optimal performance, uptime, and security. By using your hosting provider’s control panel, SSH access, or third-party monitoring tools, you can keep track of important metrics such as CPU, memory, and disk usage. Additionally, setting up automated alerts ensures that you're notified of any issues before they affect your website or application. Regularly checking the status of your VPS helps maintain stability and ensures that your server resources are used efficiently.

Let’s talk about the future, and make it happen!
By continuing to use and navigate this website, you are agreeing to the use of cookies.
Find out more


